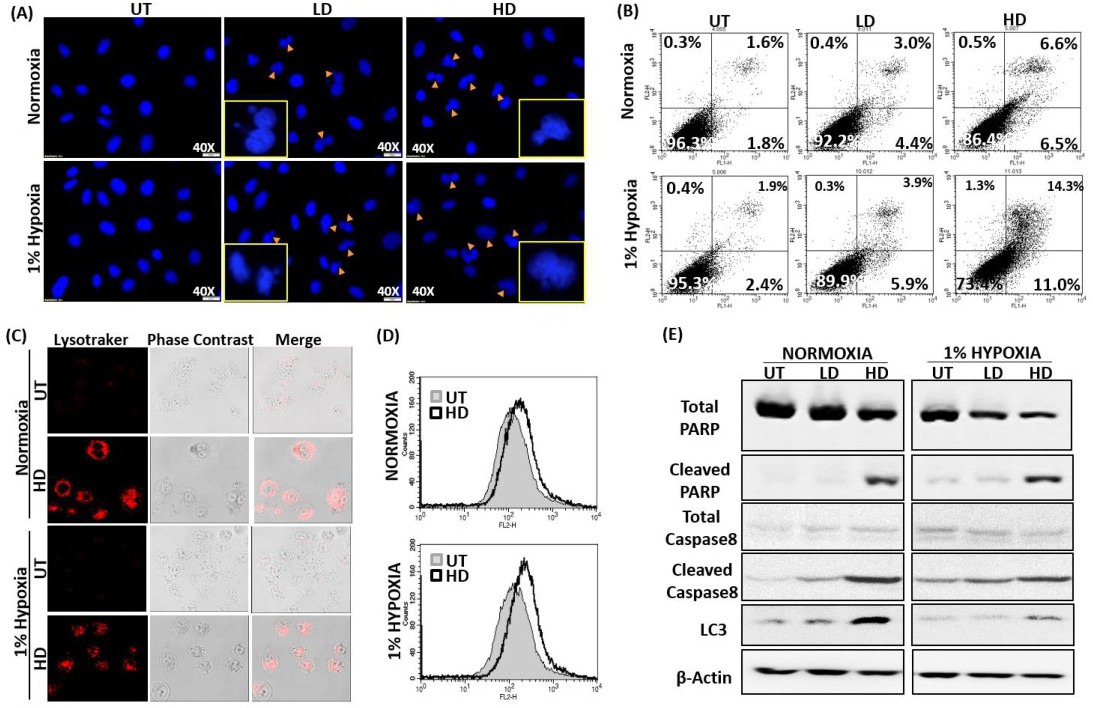
Fig. 2. Induction of apoptosis and autophagy by allicin in A549 cells in normoxia and 1% hypoxia. (A) Representative microphotograph of DAPI stained A549 cells after treatment with 10μg/ml (LD) and 40μg/ml (HD) allicin for 24hr in normoxic and hypoxic condition at 40X magnification. Yellow triangle indicates cells undergoing apoptosis. Inset represents enlarged image of apoptosing cells with condensed nuclei, blebbing of the membrane and budding of apoptotic bodies. (B) Flow cytometry analysis of Annexin V-FITC/PI stained A549 cells showing an increase in the percentage of the early apoptotic (Annexin V++/PI-) and late apoptotic (Annexin V+/PI+) cells after allicin treatment in dose dependent manner in both normoxia and 1% hypoxia (C, D) Representative microphotograph at 60X magnification and Histogram overlay after LysoTracker Red DND-99 staining in A549 cells in response to 40μg/ml (HD) allicin treatment for 24hr in normoxic and hypoxic condition. (E) The protein levels of cleaved PARP, cleaved Caspase 3 and LC3 confirmed the induction of apoptosis and autophagy by allicin in A549 cells in normoxic as well as hypoxic conditions. UT= untreated.